Key IT Asset Management Metrics Every IT Manager Should Track
IT Asset Management Metrics help IT managers track utilization, cost, reliability, and compliance. Learn the key metrics to improve control and cut waste.
IT asset management metrics, or ITAM metrics, are the key to understanding how well your organization is managing its technology. They provide the numbers behind what’s working, what’s being wasted, and where improvements are needed.
These metrics make it easier to see if your assets are being used efficiently, if your software licenses are worth the cost, and if you're meeting vendor requirements. A full inventory is useful, but the real value comes from knowing how those assets perform and contribute to your goals.
ITAM metrics turn guesswork into smart decision-making. They help IT managers stay focused on performance, cost, risk, and compliance in a measurable and meaningful way.
Here are the key categories and metrics to focus on.
Read also: What is IT Asset Management (ITAM)?

1. Asset Utilization & Efficiency
Tracking how efficiently your IT assets are used helps you cut unnecessary costs and get the most out of what you already own. These metrics show what’s being actively used, what’s sitting idle, and where you can improve allocation.
Asset Utilization Rate
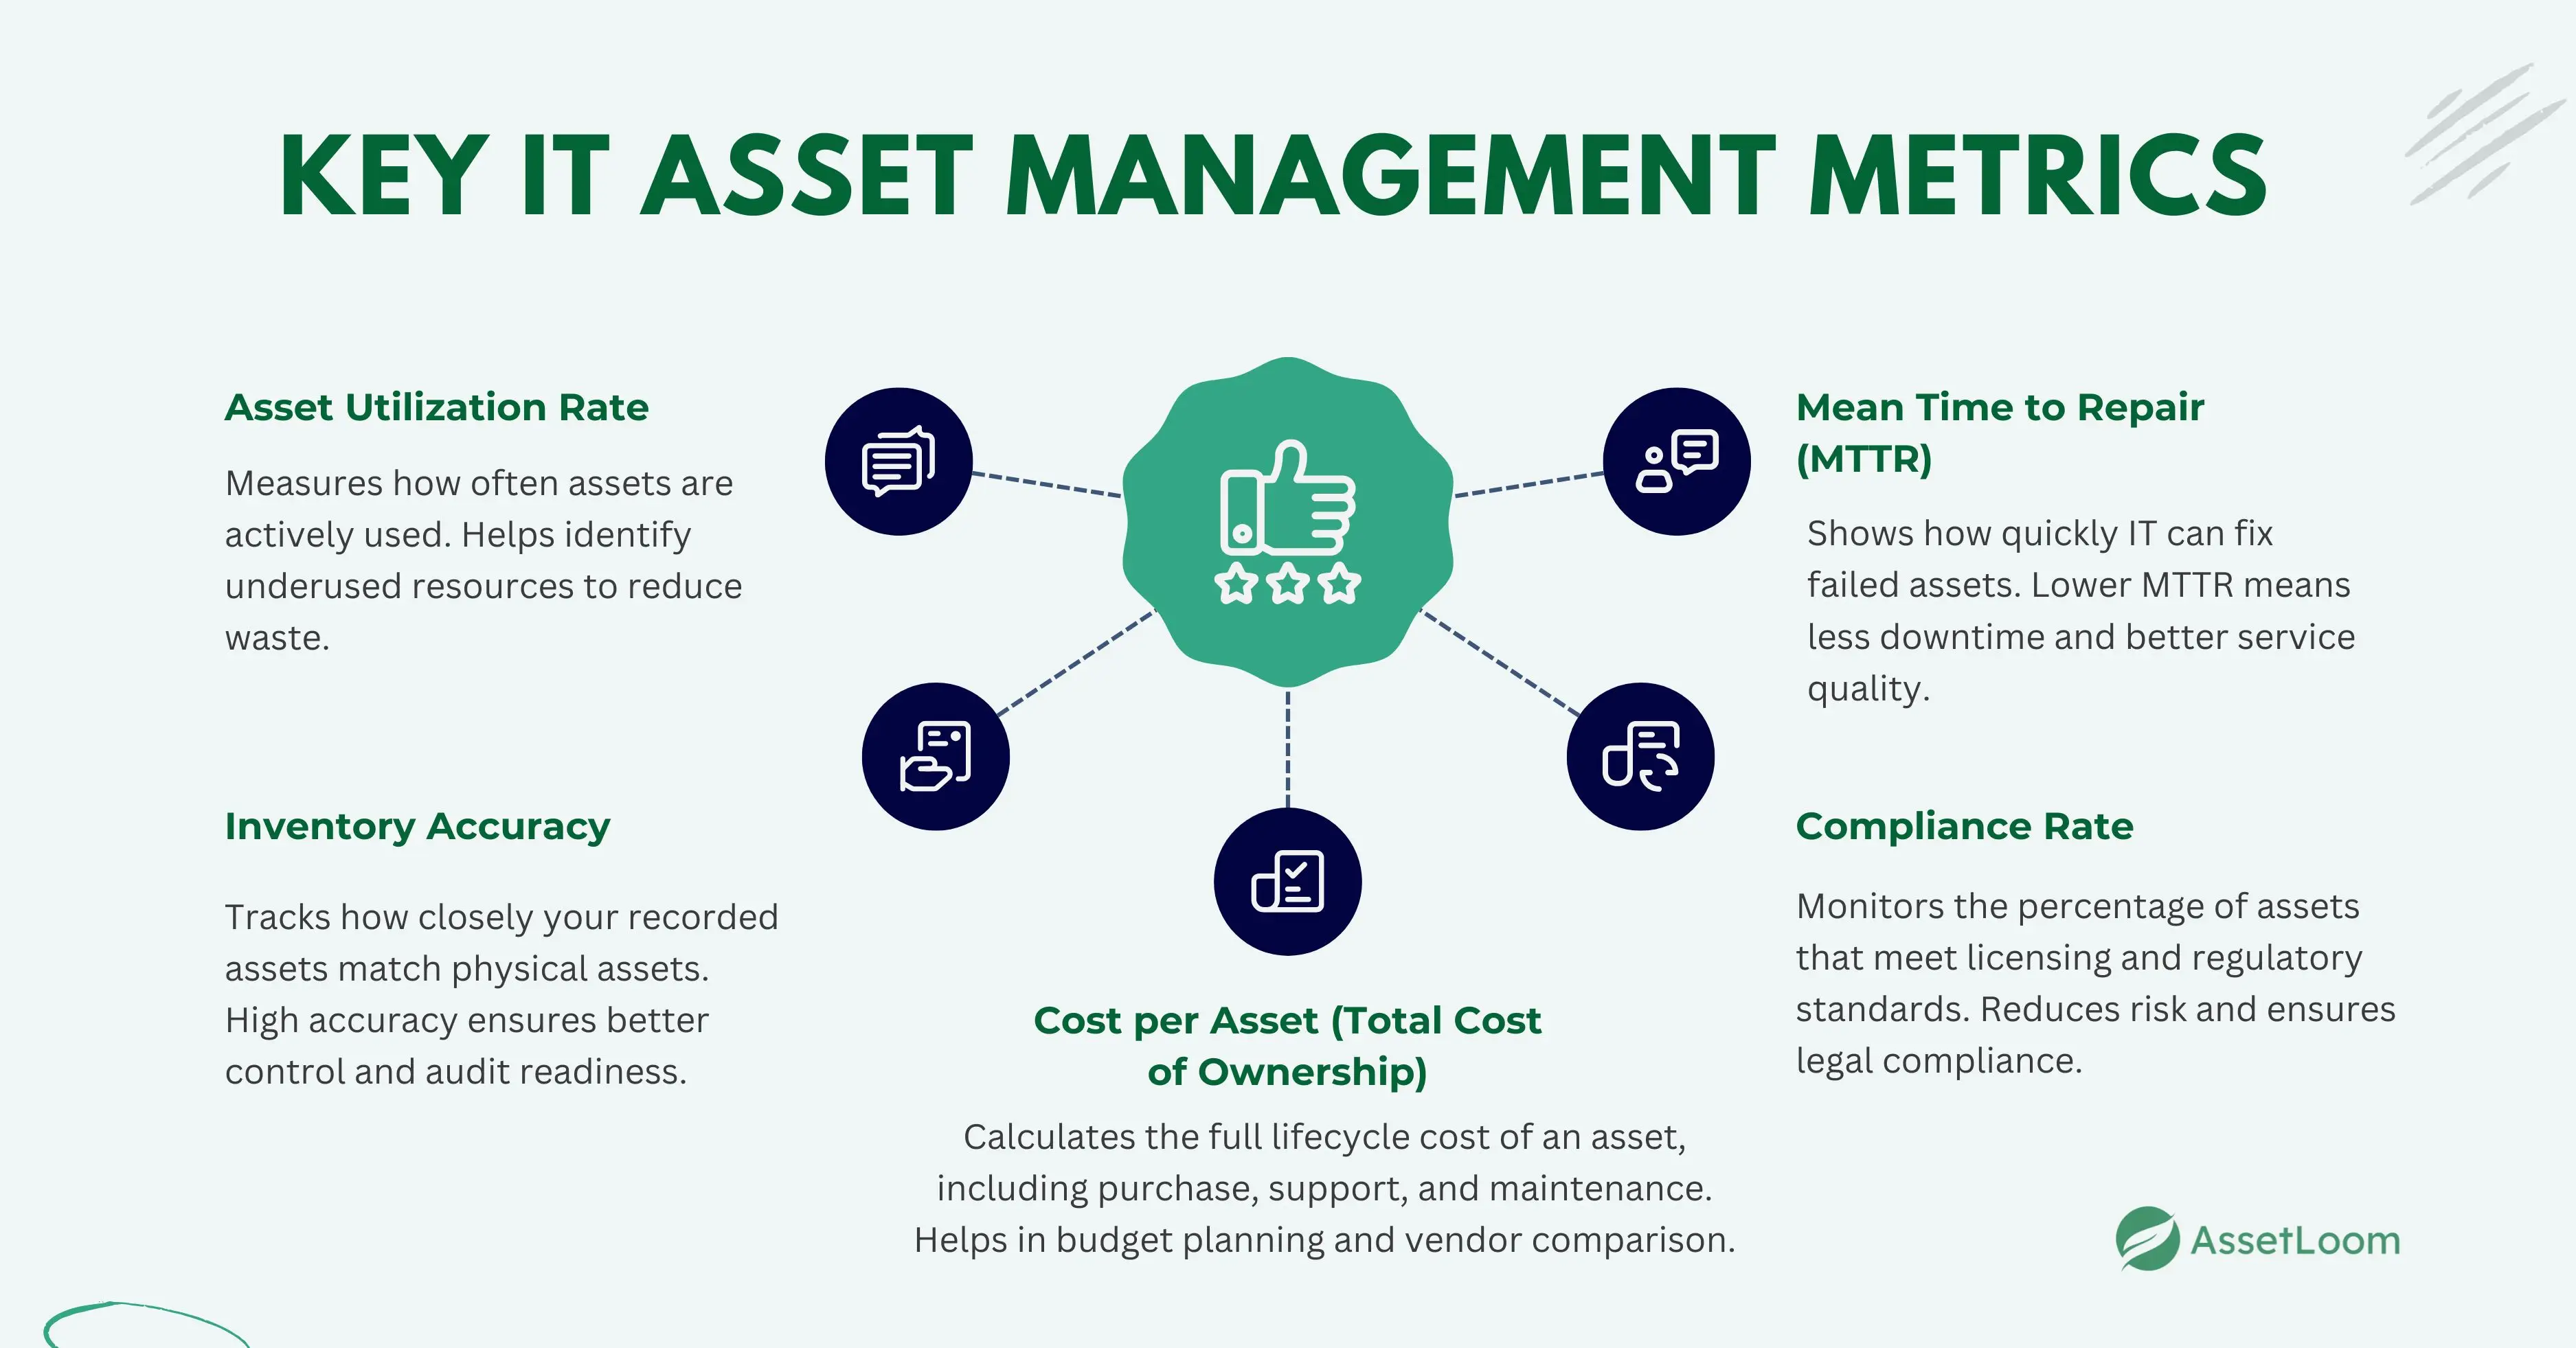
What it measures: Asset Utilization Rate shows how often your IT assets are actively used during a specific time period. It helps identify which assets are being used efficiently and which ones are sitting idle.
How to calculate: Asset Utilization Rate (%) = (Number of Active Assets / Total Assets) × 100
Example: Let’s say you manage a fleet of 100 laptops.
- 80 of them are used at least once per week (based on system login data or endpoint tracking).
- 20 are stored in a cabinet and haven’t been used for over 30 days.
- Asset Utilization Rate = (80 / 100) × 100 = 80%
How to Track It
- Use IT asset management tools like AssetLoom to automatically collect usage data through agent-based monitoring or integrations with login systems.
- Define what “active use” means for your organization (e.g., used once a week, powered on for at least 1 hour daily, etc.).
- Review utilization monthly or quarterly to make informed purchasing, reallocation, or retirement decisions.
Inventory Accuracy
What it measures: Inventory Accuracy shows how closely your recorded IT asset data matches the actual physical assets in use. It reflects how reliable your asset records are and helps ensure your asset database is trustworthy for decision-making, budgeting, and audits.
How to calculate: Inventory Accuracy (%) = (Number of Verified Assets / Total Recorded Assets) × 100
Example: Let’s say your IT asset system lists 500 laptops in inventory. During a quarterly physical audit:
- You’re only able to verify 470 laptops as physically present and accounted for.
- 30 are either missing, unaccounted for, or incorrectly tagged.
- Calculation: Inventory Accuracy = (470 / 500) × 100 = 94%
How to Track It
- Perform regular physical audits (monthly, quarterly, or semi-annually).
- Use barcode scanners, RFID tags, or agent-based tracking to speed up verification.
- Leverage platforms like AssetLoom to automate comparisons between system data and audit results.
Software License Utilization
What it measures: Software License Utilization tracks how many of your purchased software licenses are actually in use. It helps identify unused or underused licenses, allowing you to save costs or redistribute licenses more effectively.
How to calculate: Software License Utilization (%) = (Number of Used Licenses / Total Purchased Licenses) × 100
Example: Let’s say your organization purchased 300 Adobe Creative Cloud licenses.
- License reports show that only 210 users actively used the software in the past 30 days.
- Calculation: Software License Utilization = (210 / 300) × 100 = 70%
How to Track It
- Use software asset management tools or license management features in platforms like AssetLoom to track real-time usage.
- Define what counts as “active use” (e.g., a login or license activation within the past 30 or 60 days).
- Compare usage reports with procurement data regularly to spot trends.
2. Asset Lifecycle Management
Managing IT assets well means more than just tracking where they are today. It’s about understanding the entire journey of each asset, from purchase to retirement.
Asset Lifecycle Tracking
What It Measures: Tracks where each asset is in its lifecycle—typically across these phases: Procurement → Deployment → Active Use → Support/Maintenance → Retirement/Disposal. This gives IT managers visibility into asset health, aging, support needs, and upcoming replacements.
How to Calculate: This isn’t a single percentage but a distribution-based analysis. You calculate the number of assets in each lifecycle phase, then evaluate the overall asset pool based on age and status.
Formula Format: Lifecycle Phase Percentage = (Number of Assets in Phase / Total Assets) × 100
Example: You manage 500 assets. Here’s the breakdown:
- 50 in procurement
- 100 recently deployed
- 250 in active use
- 70 in maintenance
- 30 marked for disposal
Calculation (for each phase):
- Procurement = (50 / 500) × 100 = 10%
- Deployed = (100 / 500) × 100 = 20%
- Active Use = (250 / 500) × 100 = 50%
- Maintenance = (70 / 500) × 100 = 14%
- Disposal = (30 / 500) × 100 = 6%
This shows that 50% of your assets are in active use, while 20% are still being rolled out and 6% are ready to be decommissioned. These insights support planning, budgeting, and better lifecycle management.
How to Track It
- Assign lifecycle status to each asset using an ITAM platform like AssetLoom (e.g., “In Use,” “Under Maintenance,” “Near End-of-Life”).
- Monitor purchase date, warranty expiry, and maintenance history.
- Create automated alerts for upcoming replacements or contract renewals.
Optional Metric: Average Asset Age
Formula: Average Asset Age = (Sum of Asset Ages) / Total Number of Assets
Example: You have 5 servers aged 2, 3, 3, 4, and 5 years. Average Age = (2 + 3 + 3 + 4 + 5) / 5 = 3.4 years
Aging assets often mean more maintenance, slower performance, and higher failure risk—use this metric to guide proactive refresh cycles.
Read Also: What Is IT Asset Lifecycle Management?
3. Cost & ROI Metrics
These metrics help IT managers make informed financial decisions, justify budgets, and identify opportunities to cut unnecessary expenses.
Cost per Asset (Total Cost of Ownership)
What It Measures: Cost per Asset, often referred to as Total Cost of Ownership (TCO), represents the complete cost of owning and maintaining an IT asset throughout its lifecycle. This includes not only the purchase price, but also all the ongoing costs like maintenance, support, software, licensing, and even disposal.
Formula: Cost per Asset = (Total Ownership Cost of Assets) / (Number of Assets)
Where Total Ownership Cost includes:
- Purchase price
- Setup/configuration costs
- Software licensing
- Maintenance and support
- Energy consumption (optional)
- Decommissioning or disposal costs
Example: Let’s say you purchase 50 laptops for your team:
- Purchase cost: 50 × $900 = $45,000
- Software and license fees: $5,000
- Support and maintenance over 3 years: $7,500
- Decommissioning cost: $2,500
Total Ownership Cost = $45,000 + $5,000 + $7,500 + $2,500 = $60,000 Cost per Asset = $60,000 / 50 = $1,200
So, even though each laptop cost $900 upfront, the real cost per asset is $1,200 once you factor in everything else.
How to Track It
- Include cost tags for licenses, support, and contracts
- Review this metric annually or by asset category to identify high-cost or low-value assets
Return on Assets (ROA)
What It Measures: Return on Assets (ROA) shows how efficiently your IT assets are generating value for the business.
Formula: ROA (%) = (Net Benefit or Revenue Generated from Assets / Total Cost of Assets) × 100
*“Net Benefit” could mean cost savings, increased output, reduced downtime, or direct revenue depending on your environment.
Example: Let’s say your company invested $200,000 in IT infrastructure (servers, software, and laptops) to support a new remote support team.
That team helps bring in $500,000 in new service contracts over the year.
ROA = (500,000 / 200,000) × 100 = 250%
This means your IT assets generated 2.5x their cost in return an excellent outcome.
How to Track It Define “return” based on your business context: revenue, efficiency gains, or operational savings.
Track ROA by department, asset type, or project to prioritize future investments.
Software License Compliance
What It Measures: Software License Compliance checks whether your organization is using software in line with licensing agreements. It ensures that every deployed software copy is properly licensed and that you’re not exceeding usage limits or violating vendor terms.
Formula: Compliance Rate (%) = (Number of Compliant Licenses / Total Licenses in Use) × 100
Example: Let’s say your company is using 180 copies of Microsoft Office. After a license audit, you find that only 162 of those are properly licensed.
Compliance Rate = (162 / 180) × 100 = 90%
This means 10% of your software usage is out of compliance, which could expose your organization to penalties.
How to Track It Use IT asset management software like AssetLoom to keep a centralized view of license entitlements, assignments, and usage.
Regularly audit installed software vs. license availability.
Set alerts for expired licenses, unassigned keys, or usage beyond purchased limits.
Read also: The Importance of Software License Management for Businesses
Cost Savings from Efficient Asset Management
What It Measures: This metric tracks the financial savings your organization gains through better IT asset practices. It’s a direct reflection of how good asset management reduces waste and improves budget efficiency.
How to Calculate: There isn’t one fixed formula, but here’s a simple way to approach it:
Cost Savings = Estimated Spend (before improvements) – Actual Spend (after improvements)
You can also calculate specific types of savings, like:
- License savings from unused software deactivations
- Hardware savings from reassigning rather than buying new
- Operational savings from faster repairs or fewer outages
Example: You identify and remove 40 unused software licenses that cost $150 each per year.
-> Savings = 40 × $150 = $6,000/year
By improving asset reliability, you reduce employee downtime by 300 hours annually. With an average labor cost of $50/hour:
-> Savings = 300 × $50 = $15,000
Instead of buying 25 new laptops at $1,000 each, you reassign existing underused ones.
-> Savings = 25 × $1,000 = $25,000
How to Track It Compare current spending trends against historical data.
Use asset management reports from AssetLoom to identify reclaimed assets, reduced purchases, or unused licenses.
Document and categorize each cost-saving action for clear reporting to leadership.
4. Reliability & Performance Metrics
Your IT assets are only as valuable as their ability to perform reliably. These metrics focus on uptime, responsiveness, and failure trends, helping IT managers keep systems running smoothly and reduce interruptions that impact productivity.
Mean Time Between Failures (MTBF)
What It Measures: MTBF is a measure of reliability. It shows the average time an asset operates before it experiences a failure. This metric helps IT teams understand how long equipment can be expected to run smoothly and is especially useful for servers, networking gear, or high-use hardware like printers or point-of-sale devices.
Formula: MTBF = Total Operating Time / Number of Failures
*Operating time is the period the asset is expected to be working (e.g., hours per week or per month), not counting scheduled downtime like maintenance.
Example: You monitor a network switch that runs 24/7. Over 30 days, that’s:
Total Operating Time = 24 hours × 30 days = 720 hours
- It fails 2 times during that period.
- MTBF = 720 hours / 2 failures = 360 hours
This means that, on average, the switch runs for 360 hours before it experiences a failure.
How to Track It Use your IT service desk or incident tracking system to log asset failures.
Analyze MTBF by asset type, model, or vendor to identify weak points in your infrastructure.
Mean Time to Repair (MTTR)
What It Measures: MTTR is a measure of how quickly your team can respond to and fix an IT asset after it fails. It includes the time spent diagnosing, repairing, testing, and restoring the asset to full working condition.
Formula: MTTR = Total Downtime from Failures / Number of Failures
*This includes only unplanned downtime due to failures, not scheduled maintenance.
Example: Over the past month, your IT team handled 4 server failures, and the total time spent repairing them was 10 hours.
MTTR = 10 hours / 4 failures = 2.5 hours
On average, it takes 2.5 hours to resolve each server issue.
How to Track It Use your ticketing system or IT service management (ITSM) tool to log failure start and end times.
Review failure resolution time regularly and flag assets or areas where MTTR is trending high.
Set internal benchmarks (e.g., "All hardware issues resolved in under 4 hours") to monitor IT support performance.
Asset Availability
What It Measures: Asset Availability measures the percentage of time an IT asset is operational and ready for use. It tells you how dependable your equipment is and how often it’s available to users when they need it.
Formula: Availability (%) = [(Total Time – Downtime) / Total Time] × 100
*Total Time = The time the asset is supposed to be available (e.g., 24/7 or business hours).
Downtime = Any unplanned time the asset was not usable.
Example: You monitor a business-critical server over one month:
- Total Time in a 30-day month = 30 × 24 = 720 hours
- Unplanned Downtime during the month = 10 hours
Availability = [(720 – 10) / 720] × 100 = (710 / 720) × 100 ≈ 98.6%
So, your server was available and working 98.6% of the time.
How to Track It Define "available" based on your business context (e.g., available during business hours, or 24/7 for critical systems).
Review availability monthly for high-impact assets like servers, printers, or network equipment.
Failure Resolution Time
What It Measures: Failure Resolution Time is the total time it takes to fully resolve an asset issue—starting from when the problem is reported until the asset is back to normal operation. This includes diagnosing the issue, applying a fix, testing, and closing the incident.
How to Calculate: There’s no complex formula—just track the time from incident report to incident resolution.
Failure Resolution Time = Resolution Timestamp – Report Timestamp
Example: A user submits a support ticket for a crashed laptop at 9:15 AM. IT resolves the issue and marks it closed at 12:45 PM.
Failure Resolution Time = 3.5 hours
You can then average this across multiple incidents:
If 5 issues were resolved in: 2h, 4h, 3.5h, 1.5h, and 5h —> the Average Resolution Time = (2 + 4 + 3.5 + 1.5 + 5) / 5 = 3.2 hours
How to Track It Use your IT service desk or ticketing system to log timestamps for each support request.
Categorize tickets by asset type or severity to spot trends.
5. Compliance & Risk Management
While cost and performance metrics help optimize day-to-day operations, compliance and risk metrics protect your organization from costly penalties, data breaches, and operational disruptions.
Compliance Rate
What It Measures The percentage of IT assets that meet required compliance standards—such as software licensing, security policies, or regulatory requirements (e.g., GDPR, HIPAA).
Formula Compliance Rate (%) = (Compliant Assets / Total Audited Assets) × 100
Example Out of 500 assets reviewed during an audit, 470 are fully compliant.
Compliance Rate = (470 / 500) × 100 = 94%
Why It Matters Non-compliant assets can lead to legal fines, data loss, and failed audits. Monitoring this metric helps prioritize remediation efforts.
Vendor Performance Metrics
What It Measures Evaluates how well your IT vendors meet expectations related to service delivery, support response time, hardware quality, or software uptime.
Key Metrics Can Include
- SLA adherence rate
- On-time delivery rate
- Incident response time
- Asset failure rate by vendor
Example If a hardware vendor promises a 4-hour support window but consistently takes 8+ hours, their SLA adherence might be just 50%, impacting service reliability.
Why It Matters Holding vendors accountable helps improve service quality and guides future contract negotiations.
Risk Mitigation Score (or Index)
What It Measures Represents how well your ITAM practices are reducing operational, financial, or compliance-related risks. It can be a custom score based on key indicators such as:
- % of assets with current security patches
- % of assets with verified warranties
- % of assets tracked with accurate lifecycle data
- % of software in license compliance
Example (Custom Score): If 85% of assets are patched, 90% are under warranty, and 95% are properly inventoried, you might create a composite risk mitigation score of ~90%.
Why It Matters Tracking risk gives you a clearer view of how secure and resilient your IT environment is. It also helps justify security investments and prepare for audits.
How to Track These Metrics
- Set up policy checks for license status, patch levels, and lifecycle stages
- Use vendor scorecards to monitor and compare supplier performance
You don’t need complex spreadsheets or manual audits to get started. With the right tools in place, like AssetLoom, tracking these IT asset management metrics becomes simple, automated, and impactful. From cost control to compliance, you'll gain the visibility and confidence to make better IT decisions every day.

Related Blogs
Subscribe for Expert Tips and Updates
Receive the latest news from AssetLoom, right in your inbox.


