How to Use Software Monitoring Software to Detect and Resolve System Issues
Discover expert tips and tricks to leverage software monitoring software for detecting, diagnosing, and resolving system issues quickly and effectively.
For IT teams, downtime and system glitches are constant headaches. Slow apps, unresponsive servers, and network issues can disrupt everything, putting pressure on teams to fix problems fast.
Software monitoring software is a lifesaver, offering real-time insights to catch issues early and resolve them quickly. But many struggle to use it to its full potential.
This blog will share practical tips to help IT professionals set up alerts, troubleshoot faster, and automate fixes, all while keeping systems running smoothly.
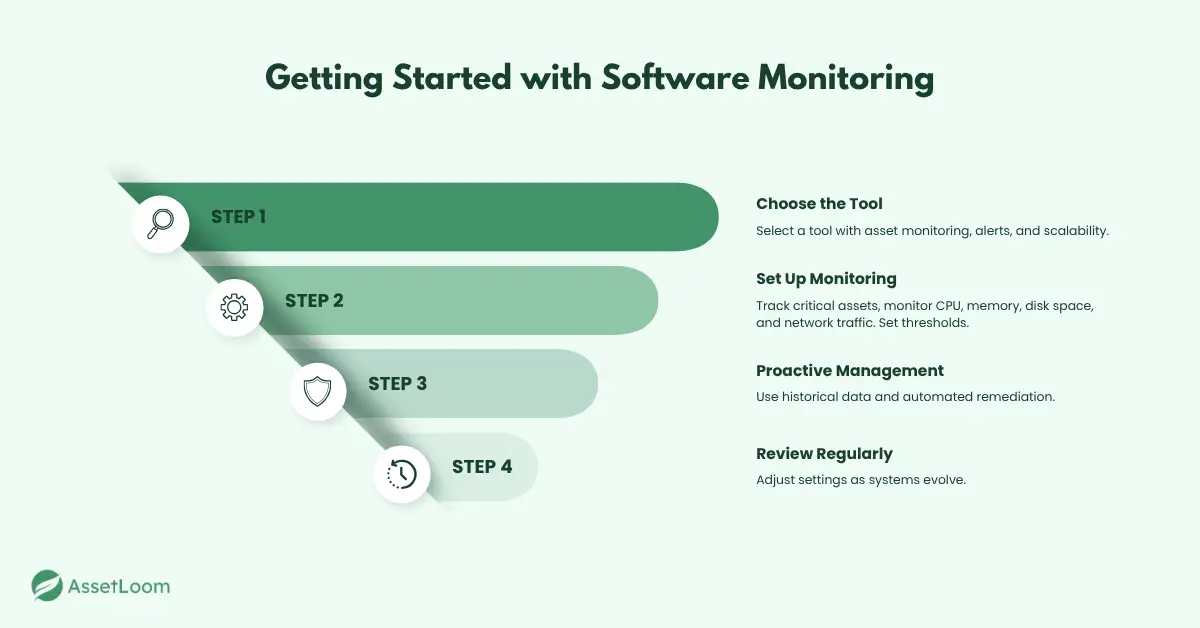
Getting Started with Software Monitoring Software
Setting up software monitoring software is key to managing your IT infrastructure. With the right tool, teams can track critical IT assets like servers, applications, and network devices, ensuring everything runs smoothly.
Choose the Right Monitoring Tool
Start by selecting a tool that supports asset monitoring for real-time visibility into device and system health. Make sure it integrates easily with your existing systems, provides real-time alerts, and is scalable as your needs grow.
Set Up Monitoring for Critical Assets
Next, configure the software by identifying key assets: servers, storage, network devices, and applications. Monitor key metrics such as CPU usage, memory, disk space, and network traffic. Set thresholds so alerts trigger when performance dips, allowing you to act before problems arise.
Leverage Asset Monitoring for Proactive Management
Proactive monitoring is crucial. By tracking historical data, you can spot trends and address potential issues early. Many tools offer automated fixes like service restarts, reducing downtime and resolving problems quickly.
Review and Adjust Over Time
As your infrastructure evolves, so should your monitoring setup. Review and adjust your configurations periodically to ensure alerts stay relevant and your system remains healthy.

Identifying Issues Early with Key Metrics and Alerts
To prevent problems from escalating, software monitoring software needs to focus on the metrics that matter most. Setting up the right alerts is crucial for catching issues early and minimizing downtime.
Start by monitoring critical resources: CPU usage, memory, disk space, and network traffic. These are the first indicators of potential system failures. Set thresholds that match your environment's baseline performance. For example, if your servers typically run at 60% CPU usage, set an alert for 85% to prevent overload. Likewise, configure alerts for disk space; if it hits 80% of capacity, it’s time to take action.
It’s also worth using historical trends to fine-tune your alert settings. If you notice that disk space usage increases gradually over time, set an alert to trigger a few weeks before it becomes critical, rather than waiting for the immediate issue.
Make Alerts Actionable
Alerts should trigger a clear next step. For critical alerts (like a server going down or a major service failure), set them to notify the right team instantly via email, SMS, or integrated chat tools. For less urgent warnings (such as high memory usage or bandwidth spikes), configure them to go into a monitoring dashboard for review at a set time, say, once a day.
Also, automate responses where possible. For example, if a service is down, configure the monitoring software to automatically restart it. For recurring disk space issues, automate cleanup or notify the responsible team to handle it.
The key here is to act on alerts quickly and automate where possible. This will help you minimize downtime and keep everything running smoothly.
Troubleshooting System Issues Using Monitoring Data
When an issue arises, your monitoring software should be your first stop for troubleshooting. Instead of guessing what went wrong, dive into the data to find the root cause.
Start by reviewing historical data. If an application is slow or a server crashes, check the performance metrics leading up to the issue. Was CPU usage unusually high? Did memory consumption spike? Identifying patterns like these can help you quickly understand what happened.
If you're dealing with high CPU usage, look at the logs to see which processes are using the most resources. Many monitoring tools let you drill down into detailed performance logs, so you can pinpoint exactly what’s causing the problem.
Diagnose with Data, Not Assumptions
Rely on the data, not guesses. Use resource utilization graphs to spot usage spikes. For network issues, check traffic logs for signs of congestion. These insights help you focus on the real problem and avoid wasting time on unnecessary fixes.
For example, if disk I/O is slowing down, checking disk health metrics might reveal a failing disk. If memory leaks are detected, you can trace the issue back to a specific application or service.
Resolve Issues Fast with Automated Actions
Once you’ve pinpointed the issue, it’s time to take action. For many common problems, you can automate fixes directly from the monitoring tool. Set up triggers to restart services or clear cache when resources reach a certain limit. This saves time and ensures small issues are fixed automatically without needing intervention.
For more complex issues, use the insights to take quick action—whether it’s scaling resources, tweaking configurations, or updating software to address vulnerabilities.
Resolving Issues with Software Monitoring Tools
Once you’ve spotted a problem, it’s time to tackle it head-on. Software monitoring tools aren’t just for finding issues; they’re also there to help you fix them quickly and efficiently, minimizing downtime.
Start by taking advantage of the automated remediation features many tools offer. For common problems like service failures, low disk space, or high memory usage, you can set up the software to act immediately. For instance, you can have it restart services automatically if they fail or clear out temporary files when disk space is running low. This way, the software does the heavy lifting, and you don’t have to step in unless needed.
For more complicated issues, you’ll need to dive into the details. Use the insights from your monitoring tools to guide your next steps. If a service is constantly failing because it’s running out of resources, it might be time to adjust the server’s resource limits or optimize the application settings. For network problems, check your load balancing and scale your resources to handle the extra traffic.
Automate Simple Fixes and Tackle Complex Issues Head-On
Not every issue requires you to jump in manually. The more you can automate, the better. For example, automate things like disk space management by scheduling regular cleanups or archiving old files. You can also set up auto-scaling to handle traffic spikes or unexpected increases in resource usage without manual intervention.
For the bigger, more complex problems, use the data gathered from monitoring to help you make informed decisions. If your database is running slowly, take a closer look at the logs and query performance metrics to find out what’s slowing it down. If servers are at full capacity, check the usage trends and determine if it’s time to add more hardware or virtual resources.
Take Action Quickly to Minimize Impact
The faster you address issues, the less they’ll affect your system. With software monitoring tools, you get real-time insights, meaning you don’t have to wait for users to notice problems. Stay one step ahead by regularly reviewing the data and making adjustments as needed to keep things running smoothly.
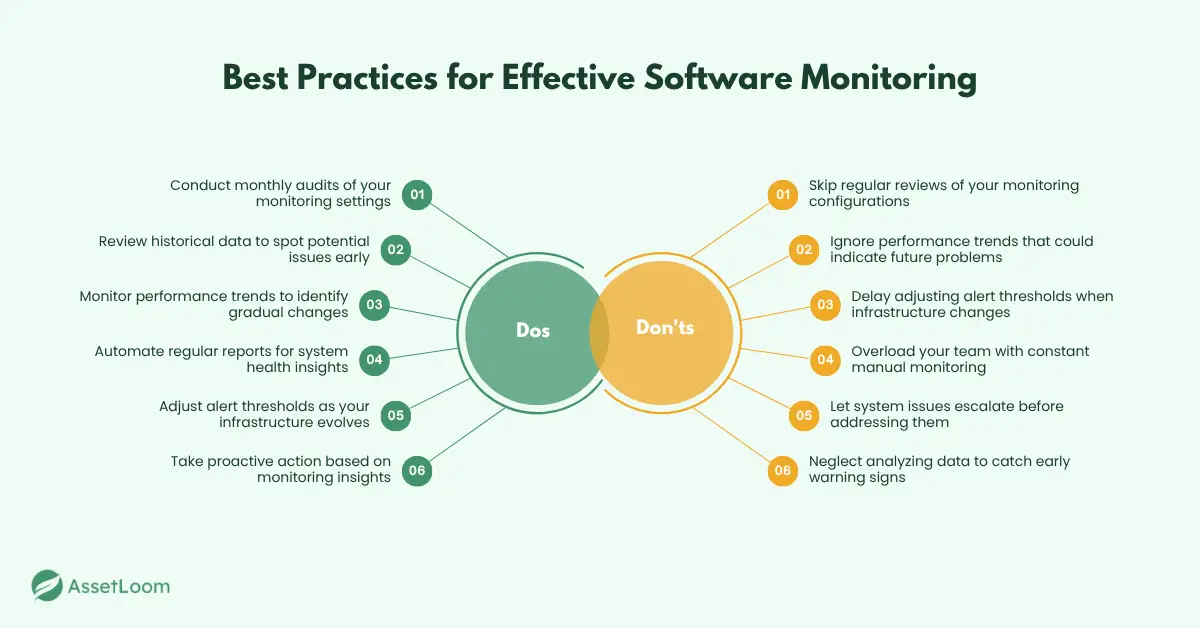
Best Practices for Ongoing System Health and Maintenance
To ensure your systems stay in top shape, regular reviews and adjustments are essential. Here are a few key practices that can help:
1. Conduct Monthly Audits
It’s crucial to perform monthly audits of your monitoring settings. As your infrastructure evolves - whether you're adding new servers or upgrading applications - your monitoring setup needs to evolve as well. A quick monthly review ensures that all critical assets are being tracked properly and that alert thresholds are still relevant.
2. Review Historical Data and Performance Trends
Look at historical data to catch potential issues early. By monitoring performance trends, you can identify slow but steady increases, like rising disk space usage, that could lead to problems in the future. Spotting these trends allows you to take proactive steps before things get critical.
3. Automate Reports
Automating your reports will save time and keep you informed without having to constantly check. Set up regular automated reports that summarize key metrics, system alerts, and performance trends. This will give you a quick overview of your system’s health, whether you choose weekly or monthly reports.

Conclusion
Using software monitoring software helps IT teams stay ahead of system issues, improve performance, and reduce downtime. From setting up monitoring tools to analyzing key metrics and automating alerts, these systems give you real-time insights to prevent problems before they affect your operations.
By regularly reviewing your monitoring settings, tracking performance trends, and automating reports, you can maintain a proactive approach to IT management. These steps ensure your systems stay healthy and efficient over time.
Take action today to optimize your monitoring setup and keep your infrastructure running smoothly with less effort.

Related Blogs
Subscribe for Expert Tips and Updates
Receive the latest news from AssetLoom, right in your inbox.

