What’s Inside a Great Asset Dashboard?
Discover why an asset dashboard is essential for managing business assets. Learn its key components and benefits.
An asset dashboard is a digital tool that centralizes data about a business’s assets, such as IT equipment, financial investments, or physical inventory, into a single interface. By presenting this data in an organized, visual format, it helps businesses monitor and manage assets efficiently. This article explores the importance of an asset dashboard, its essential components, benefits, and steps for selecting and implementing one.
What Is an Asset Dashboard?
An asset dashboard is a software interface that consolidates information about assets, including their status, value, and usage, into charts, tables, or other visuals. Assets can range from laptops and servers in an IT department to stocks and bonds in a financial portfolio or machinery in a manufacturing plant. The dashboard pulls data from sources like accounting software or inventory systems, enabling users to track and analyze assets without relying on scattered records or manual processes.
For example, an IT manager might use an asset dashboard to view the number of active laptops and their warranty statuses, while a financial firm could monitor investment returns. By offering a clear view of asset data, the dashboard supports better decision-making and ITAM across industries.
Benefits of an Asset Dashboard
An asset dashboard provides several advantages for businesses managing diverse assets. Below are key benefits, with specific details on their impact.
Centralized Data Access
An asset dashboard displays all asset information in one place, eliminating the need to check multiple systems. For instance, a logistics company can see the status of its entire vehicle fleet, including location and maintenance needs, on a single screen. This saves time and reduces the risk of missing critical details.
Informed Decision-Making
By presenting data in clear visuals, such as graphs showing asset costs or usage trends, the dashboard helps managers make decisions based on accurate information. For example, a retailer can use inventory data to decide which products to restock, avoiding overstocking and minimizing storage costs.
Reduced Operational Errors
Manual tracking, such as using spreadsheets, often leads to errors like outdated data or missed maintenance schedules. An asset dashboard automates data updates, ensuring accuracy. For instance, an IT team can track software license expirations, preventing compliance issues.
Cost Savings
Monitoring assets closely helps identify cost-saving opportunities. For example, a firm might notice a machine with high maintenance costs, prompting a decision to replace it with a more efficient model, reducing long-term expenses.
Key Components of an Ideal Asset Dashboard
An effective asset dashboard includes components that provide clear insights and support practical management. Below are the essential components, with explanations of their specific value.

1. Asset Summary Snapshot
- Features: Shows the total number of assets, active versus inactive assets, assets by category (e.g., laptops, servers, software), and assigned versus unassigned assets.
- Value: Offers a quick overview, helping managers assess resource availability.
2. Asset Health & Status
- Features: Flags aging or soon-to-retire assets, highlights those needing maintenance or repair, and identifies compliance or license issues.
- Value: Prevents disruptions by addressing issues early. For instance, a warning about an expiring software license allows an IT team to renew it, avoiding service interruptions.
3. Asset Lifecycle Tracker
- Features: Tracks procurement dates, warranty or annual maintenance contract (AMC) expiry dates, and upcoming refresh or replacement schedules.
- Value: Supports planning by showing when assets need upgrades.
Related article: What Is IT Asset Lifecycle Management?
4. Financial Metrics
- Features: Displays total asset value, depreciation over time, maintenance costs, and return on investment (ROI) analysis.
- Value: Helps quantify costs and benefits for budgeting.

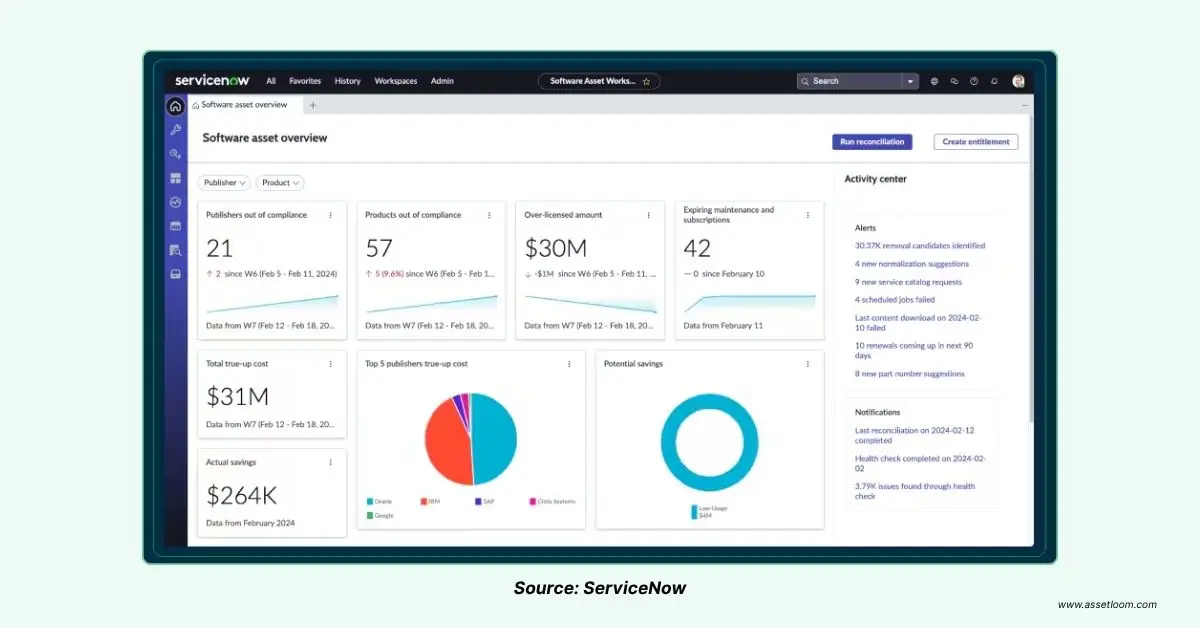
ServiceNow Asset Dashboard
5. User & Location Distribution
- Features: Shows assets assigned to users or departments and tracks assets across locations or offices.
- Value: Ensures equitable resource allocation.
Learn more: What is Asset Relocation, and How Does It Work?
6. Alerts & Notifications
- Features: Notifies users of expiring licenses, overdue asset returns, or maintenance due dates.
- Value: Prompts timely action to avoid issues. For instance, an alert about overdue equipment returns helps a construction firm recover assets from contractors.
7. Visual Charts & KPIs
- Features: Includes pie charts for asset types, line or bar graphs for usage or cost trends, and risk heatmaps for compliance or utilization risks.
- Value: Simplifies data analysis with visuals.
8. Search & Filters
- Features: Provides smart search for specific assets and filters by status, type, user, or vendor.
- Value: Saves time by quickly locating data.
9. Integration Widgets
- Features: Links to ticketing systems (e.g., Jira Service Management) for asset-related issues, displays purchase order history, and shows vendor information.
- Value: Centralizes related data, reducing the need to switch tools. For example, linking to a ticketing system shows open issues for a specific laptop directly on the dashboard.

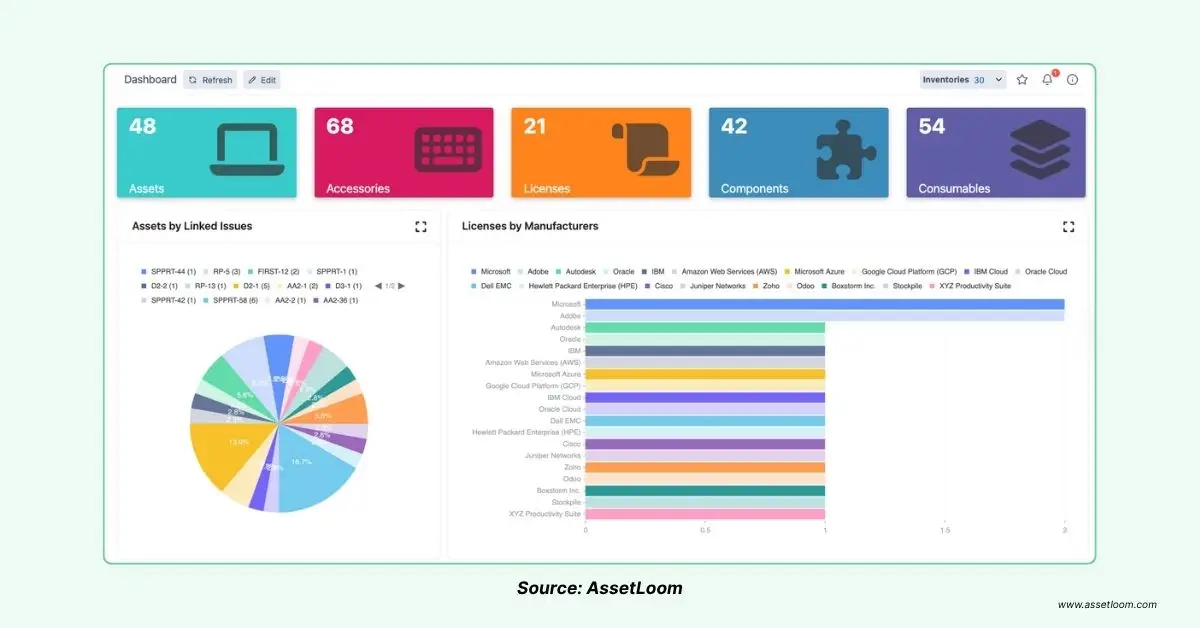
AssetLoom Dashboard
10. User Access Controls
- Features: Role-based permissions to restrict access to sensitive data, such as financial metrics or proprietary inventory details.
- Value: Protects confidentiality by limiting access. For example, only managers see investment data, while staff view operational metrics.
How to Choose an Asset Dashboard
Selecting the right asset dashboard involves evaluating your business needs and comparing tools. Follow these steps:
- Identify Asset Types: List assets like IT hardware, financial portfolios, or inventory, and the data you need, such as costs or usage.
- Test Usability: Use a demo to verify the interface is easy to navigate, with clear visuals and search functions.
- Assess Scalability: Choose a tool that can handle growing asset volumes, such as expanding from 100 to 1,000 assets.
- Review Costs and Feedback: Compare pricing and read user reviews on platforms like Capterra to ensure reliability and support.
Implementing an Asset Dashboard
To implement an asset dashboard effectively:
- Define Needs: Specify assets and metrics, such as equipment maintenance schedules or investment returns.
- Select a Tool: Choose a dashboard with the components above, like Tableau or Asset Panda.
- Integrate Data: Connect the dashboard to existing systems to pull accurate data.
- Train Staff: Provide training to ensure employees can use features like search or reports.
- Monitor Performance: Regularly review the dashboard’s effectiveness and adjust settings as needed.
Conclusion
An asset dashboard is a critical tool for managing business assets, offering centralized data access, informed decision-making, fewer errors, and cost savings. By including components like asset summaries, health trackers, financial metrics, and mobile access, it ensures businesses can monitor and optimize resources effectively. Evaluate your needs, choose a tool with robust features, and implement it thoughtfully to improve asset management in 2025.

Subscribe for Expert Tips and Updates
Receive the latest news from AssetLoom. right in your inbox


